
There are several areas of improvement on the account. I have definitely seen accounts in worse off shape and the majority of spend (190K/338K) was in the Search Network with the remainder spread out over Shopping (70K) Display (8.7K) and Video (11.2K). The recommendations that follow are designed to improve the overall efficiency of what the account is already producing and also bring new elements online.
Quantitatively the account has generated 30 million impressions which have resulted in 245,000 clicks to the website and 1,950 recorded conversion actions. Total advertising cost was $323,000. Secondary metrics indicate that the overall click-through rate for the account is 0.82% , registering an overall conversion rate of 0.30% and average cost per conversion of $166. Average cost per click of $1.32. All of these secondary metrics seem very low to me, as 0.82% click-through rate is indicative of heavy video or display network use. Also, your conversion rate is very low and I do not think it represents reality. An average cost per click of $1.32 also seems very inexpensive and I think a more realistic CPC is going to be within the $2 to $4 dollar range based on a mid-high 4 figure revenue per product.
Performance benchmarks indicate that a minimum of 2% click-through rate and conversion rate should be observed for most Google ads accounts. Similarly the 0.30% conversion rate is very low compared to the overall activity on the account and ad spend levels. The first objective needs to be a conversion overhaul with GA4 followed by the recommendations that follow.
121M
1.02M
131,000
.084%
12.54
$3.24
$25.18
As presented today, the account has 16 Active Campaigns with 9 Search and 7 Performance Max Campaigns. The Performance Max campaigns are set to maximize conversion bid strategy. Most of the search campaigns are set to manual cost per click bidding with one campaign targeting LA and San Diego, set to Target Impression Share. Most search campaigns are limited to the search engine results page except for one. Search Campaigns do not have Ad Rotation Optimization enabled.We also see bid adjustments on some but not all search campaigns. There are no device targets for the search campaigns observed.
All together there are 181 Campaigns in the account and more than 16 accounts have Data for 2022, so it seems like there has been a lot of experimentation or different managers coming in and out of this account.
Contact Music City Digital Media to take your campaigns to the next level.
Network data has an interesting story to tell. Based on available data and acknowledging the current gap in offline conversions, it appears that, in terms of conversion production, the search network is delivering the best results in overall conversion production and lowest CPA. Google search accounted for approximately 27% of the impressions served last year, however that 27% generated 70% of all the clicks to your website and 88% of all the recorded conversions. Compare that data to YouTube for instance and we see that YouTube served about 45.8% of total Impressions yet resulted in less than 1/10 of 1% of clicks and no recorded conversion actions. Cross Network traffic is represented in green below, which is another way of saying this is what your performance Max campaigns are generating for you.
Device data indicates a clear bias towards mobile devices with 76% of impressions, clicks and 75% of conversions coming from mobile devices. tablets are also present, however computers are the most interesting story here. Computers are slightly more efficient in terms of clicks/conversions. The screenshot below outlines the waterfall between Impressions clicks and conversions from a variety of devices. We can also see click-through rates, conversion rates and cost per conversion in the second graph which ,again, highlight the effectiveness of computers. Mobiles aren’t performing bad per se however it may be worth a test to see if focusing on computers gets us more conversions at a lower cost.
Contact Music City Digital Media to take your campaigns to the next level.
Location targeting seems to have a heavy bias towards California; we are seeing significant bid adjustments of 40% on many California locations. We also see the vast majority of conversion production coming out of the Golden State.
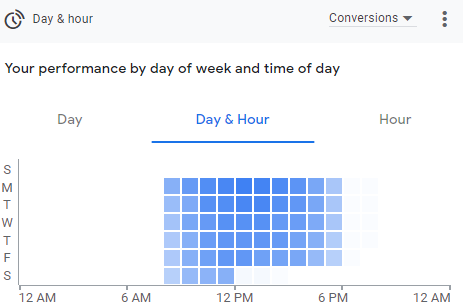
The graphs below indicate the difference between when users are clicking on your ads and coming to your website and when they are actually converting and purchasing products. You can see in the first graph, that you’re basically running ads around the clock with no ad schedules currently enabled on the account. Contrast that to the second graph which shows a clear preference for the middle of the day during regular business hours as the ideal time that a user converts.
Contact Music City Digital Media to take your campaigns to the next level.
Bid Adjustments are in use in some locations but not all. No Ad Schedule Adjustments are seen. We see some -100% Tablet Adjustments for 3 campaigns but not all. No Audience Adjustments. No Advanced Adjustments for Call Actions.

Top producing keywords seem to be firmly within the sphere of brand and model names only. It looks like there’s been some experimentation with product descriptions in terms of e-bike or electric bike and those have not been successful. It makes me wonder if not having ad rotation optimization enabled has artificially impacted the success of the keywords related to product description.
Negative Keywords? There are over 1,500 negative keywords in the account.
Contact Music City Digital Media to take your campaigns to the next level.
Conversions seem like they need some work. I can’t find an active Purchase Conversion coming into the account, I see some old ones but nothing new and registering. I also do not see any GA4 conversions.
Expanded Text Ads are found in the account. This is not uncommon and most of them have RSA’s (Responsive Search Ads) that are also enabled in the same Ad Groups. I do not see any Call Only Ad Groups, These are ads that are designed specifically for mobile and prompt users to call the business immediately. If you have the ability to field phone calls this could help drive volume for calls for you to convert directly.
Contact Music City Digital Media to take your campaigns to the next level.
It looks like there’s a full array of extensions in use on the account. We are seeing everything from site links to call outs, structured snippets, calls, location extensions, price extensions and finally promotional extensions. This looks like an excellent use of extensions in the account there’s nothing that we would really add to it other than to review that the extensions were enabled and all the appropriate campaigns.
Search impression share over 2022 was impressive, welcome to the top of the market with 14.19% of impression share for your keywords in your Geographic targets. You can see that your absolute top of page rate, meaning when your ads were shown in the number one position was 48.53% of the time, while your ads were displayed in positions 1 – 3 , 81.98% of the time. competitors in your realm include lectricbikes.com, radpowerbikes.com, specialized.com and amazon.com.