
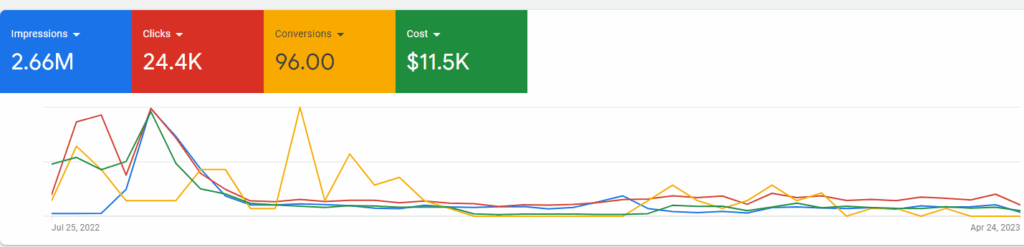
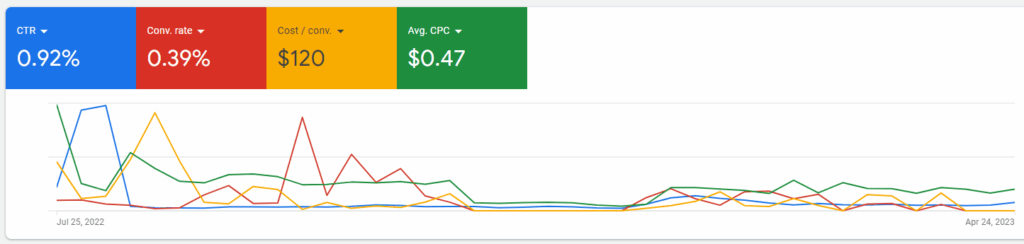
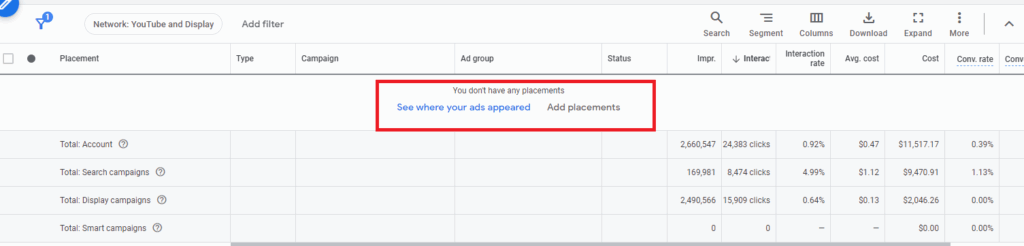
As presented the account has generated 2.66 million impressions which have resulted in 24,400 users being brought to the website. That comes out to 0.92% click-through rate which immediately tells me that the account has been using display and/or Cross-Network campaign types, in addition to search, at some level to be determined. Of those 24,000 users, 96 resulted in a conversion action which comes out to a 0.39% conversion rate. Just to jump ahead it looks like all of the conversions came from the search campaign with nothing coming from display in terms of conversion production. Total advertising costs during this time period was $11,500 with an average cost per conversion of $120 with an average cost per click of 47 cents.
For reference we’d like to see a minimum of 2% click-through rate and 2% conversion rate with any account running Google ads.
2.66M
24,000
96
.092%
0.39
$0.47
$120
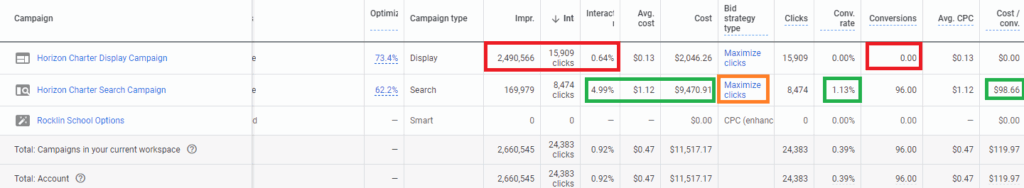
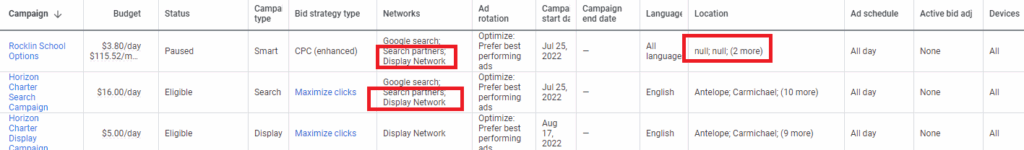
We can see one active display campaign and one Active search campaign in the account. The performance of the display campaign is typical of display with about 2.5 million impressions served with 15,900 clicks to the website, that comes out to 0.64% click through rate, which is fairly decent performance for a display campaign. The key takeaway here is no conversions were recorded from this. This could be for a variety of reasons including the lack of conversion tracking on your website with that data being tied back to Google ads. Nevertheless the interaction rate speaks for themselves, if we look at the search Campaign which generated 169,000 impressions and 8,474 clicks to the website we see that that is roughly a 5% click-through rate and significantly better than what display was producing. We also have 96 conversions recorded from search, these are calls from the ads and it looks like this was the only conversion action that was in the account. both campaigns. We also see that search partners and Display Network are opted in to the current active search campaign.
Contact Music City Digital Media to take your campaigns to the next level.
Network data supports our observations listed above. You can see by looking at the blue Google search area on the graph below that the vast majority of Impressions went to the Display Network. 0.9% of Impressions were generated on Google search resulted in 11.7% of total traffic and 100% of total conversions recorded in the account thus far. Display on the other hand is presenting an decreasing waterfall, consuming 98.1% impressions but only producing 68.3% of Clicks in an unknown number of conversions.

Device data supports our earlier Observations. we see that the majority of Impressions generated so far came from mobile devices at 55%, what is odd here to see that 43.3% came from tablets. We typically see tablet volume anywhere from between 1 to 3% of device volume, so that is unusually high. With that said, the mobile device waterfall continues generating 73% of all clicks and 100% of known conversions.
Contact Music City Digital Media to take your campaigns to the next level.
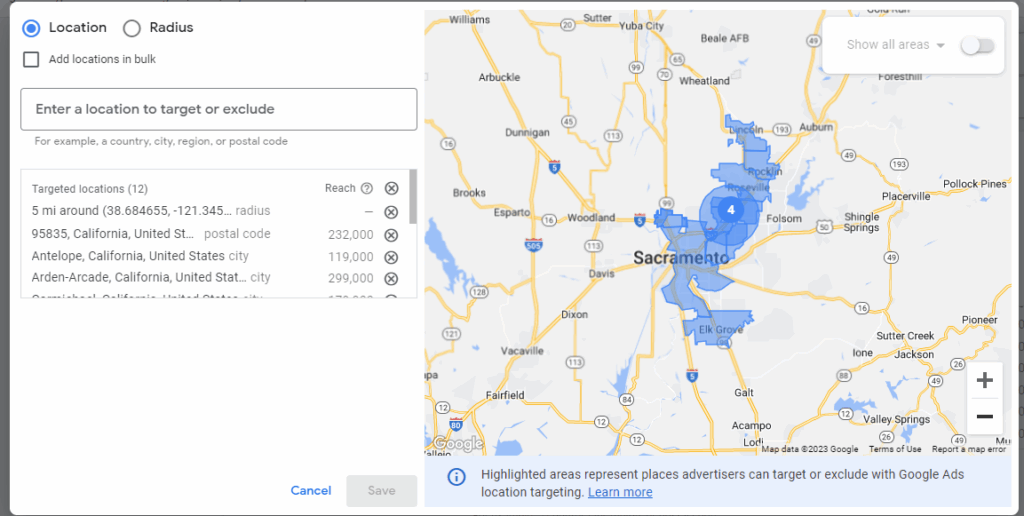
Location targeting shows a gerrymandered map of cities, postal codes and also radiuses being used for geotargeting. Typically we would see a radius dropped around a specific area with keywords driving activity. There may be reasons for targeting these specific areas that we are not aware of.
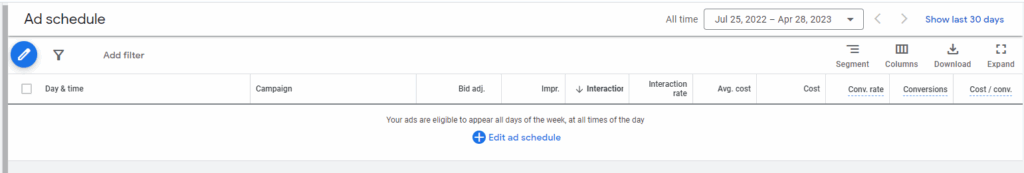
Ad scheduling is not enabled on the account.
Contact Music City Digital Media to take your campaigns to the next level.
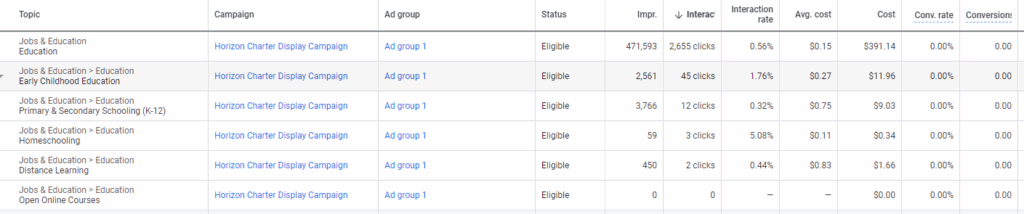
The screenshots below outline topics placements that the account has been targeting so far. We do see topics listed under display campaigns however there were no placements enabled on the account. Placements allow us to tell Google exactly what websites, applications and YouTube channels we want our ads to show up on. With that information in mind I have to report to you that the majority of clicks and Impressions generated from your display campaigns came from dating applications, you can take a look at the exact websites below.

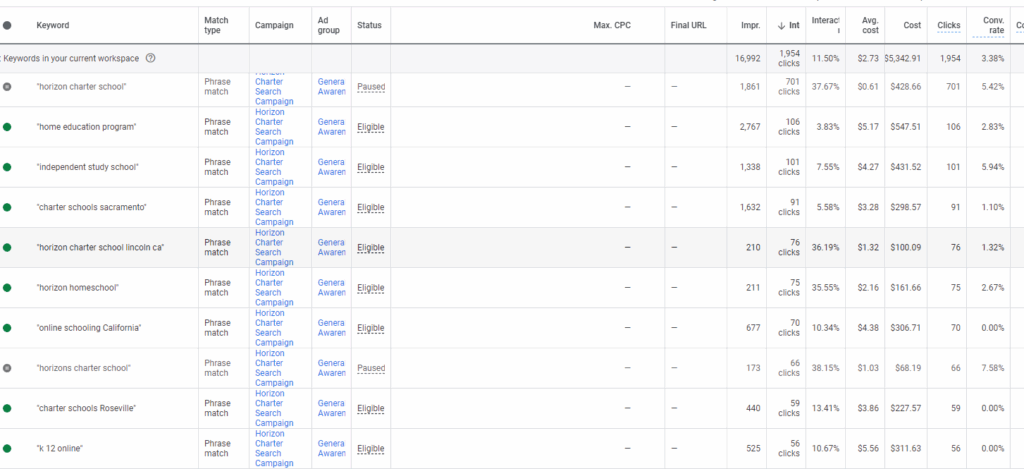
Keyword data is very consistent with what we typically see and Niche accounts. Brand names as well as service description keywords resonate throughout the account typically in phrase or exact match configuration.
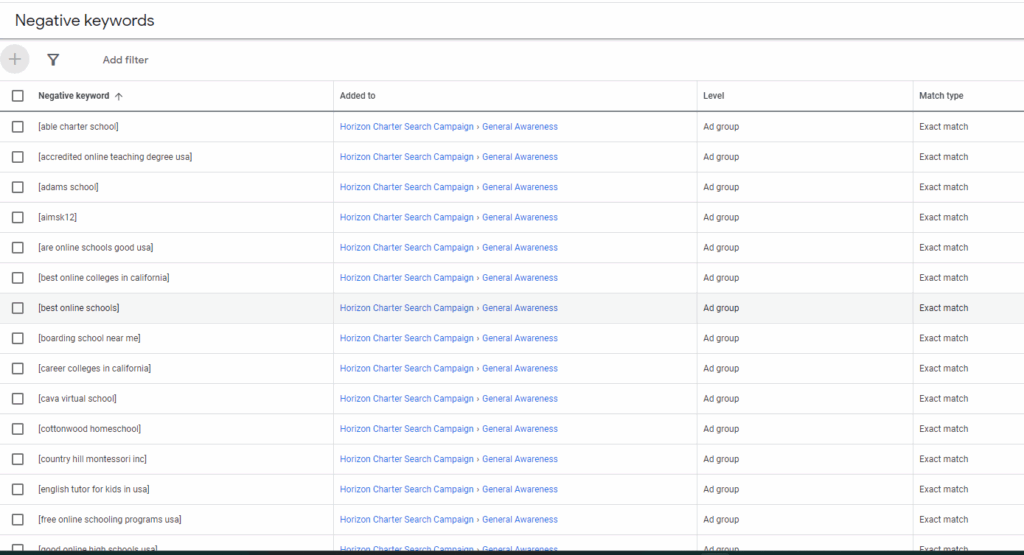
Negative Keywords? There are extensive negative keywords enabled on the account.
Contact Music City Digital Media to take your campaigns to the next level.
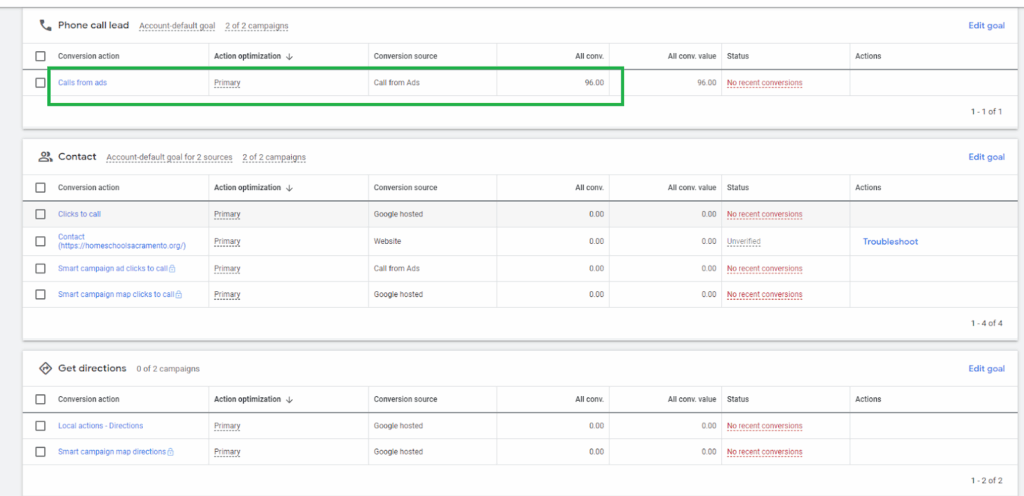
The only active conversion in the account is the “calls from ads” listed as a primary conversion action with no recent conversions listed. 96 conversion actions associated with this conversion action. We also see some other conversions in there however there are no active data sets for them.
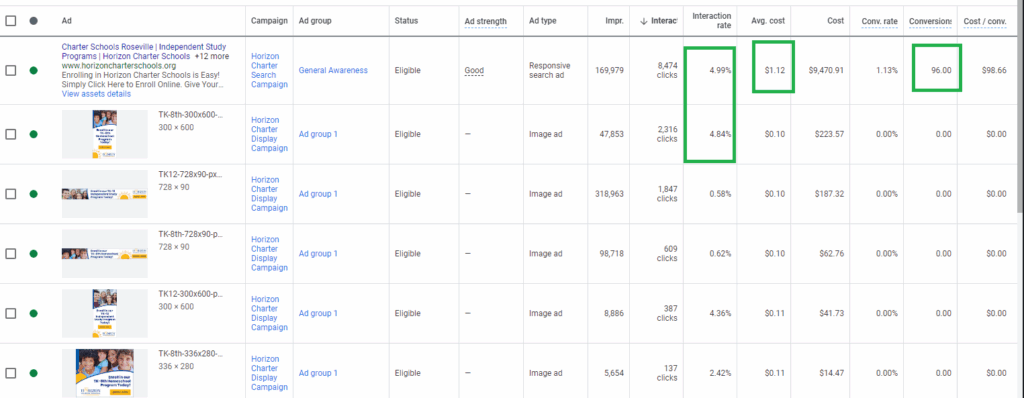
We can see the success of responsive search ads in the screenshot below, interaction rate here, as stated previously, is at 4.99% for this responsive ad group with an average cost of $1.12 per click and an overall conversion rate of 1.13%. That is a fairly decent conversion rate for this ad group and this ad set. The average cost per conversion is $98.66. We can also see some display ads which had varying levels of effectiveness and their associated advertising costs.
Contact Music City Digital Media to take your campaigns to the next level.
We see site links, calls and location extensions enabled on the account.

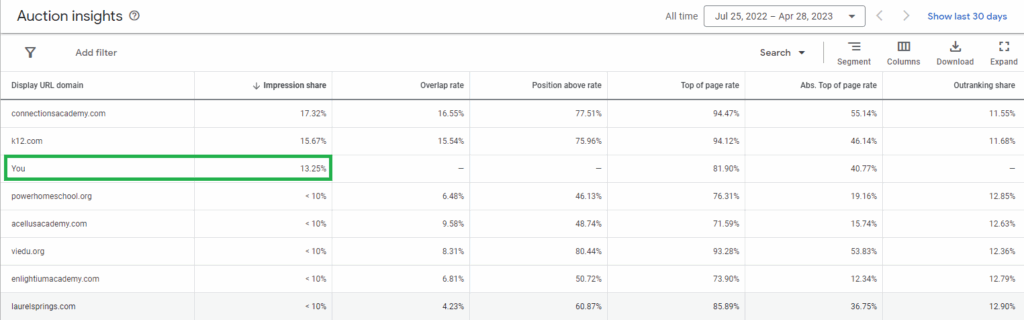
Search impression share for your account during this time was 13.25% anything under 10%, Google will not let us know what the actual value is but you cross that minimum threshold and you are competitive within your Market compared to other known advertisers. You can see connectionacademy.com and k12.com are the only two websites with a larger market share than you.
Landing Pages: